
Consumer Friendly Cable TV System
(Survey Results on Cable TV in India)
Executive Summary of Survey Results
Consumer Unity & Trust Society (CUTS) has been working on issues relating to the Cable TV industry for quite some time. This resulted in its nomination to the Conditional Access System (CAS) Implementation Committee constituted by the Ministry of Information & Broadcasting, Government of India.
In 2003, results of an all India survey done by CUTS on cable TV industry were published. The survey was done to gauge level of consumer awareness on cable television in the country. The study highlighted the following issues:
- Cable TV sector is seller’s market and operators’ function as a cartel. Nearly 70% of subscribers do not have an option to change their cable operator
- Consumer has no say in the types of channels s/he wants to watch
- There is a dire need to regulate the sector in order to prevent consumers from bearing this undue burden, both financially and mentally
- Assess the structure of cable TV market in four metros
- Gauge the level of influence, cable operators have on consumers
- Identify level of consumer awareness about CAS
- 7 out of 10 households do not have the option to change their cable operator. With no choice available, most of these households face a frequent hike in cable subscription charges
- While majority of subscribers receive more than 50 channels, most of them usually watch less than 15 channels
- 78% households pay between Rs.150-300 per month, with Kolkata being the least expensive metro and Delhi the most expensive
- Majority of respondents (63%) are not in favour of accepting Conditional Access System (CAS)
- 8 out of 10 respondents do not want any increase in their monthly bill, if CAS is implemented
With this background, CUTS undertook a second survey on Cable TV in India, which comprises of research and field surveys in the four metros where CAS was to be implemented. The survey was done by CUTS in Delhi and Kolkata, Citizen Consumer and Civic Action Group (CAG) in Chennai, and Consumer Guidance Society of India (CGSI) in Mumbai. The project received funding under the consumer welfare fund of the Ministry of Consumer Affairs, Food & Public Distribution, Government of India.
Initially the survey aimed at assessing consumer’s perception on the operational efficiency of CAS and to assess whether CAS has helped to remove or at least reduce the inefficiencies and inequities faced in the past. However, since CAS has remained a non-starter, except in Chennai and parts of Delhi, the survey was done in four metros to:
The main findings are:
Cable TV: Results of Phase I Survey (2003)
Cable Television Networks (Regulation) Amendment Bill, 2002 has now become an Act. Before the Bill was passed, CUTS, conducted an all India survey to find out primary consumer concerns in the country vis-à-vis cable TV industry and its services.
The objectives of this survey were:
- To gauge level of influence cable operators (COs) have on consumers
- To gauge level of consumer awareness on Cable TV
- To get feedback from consumers for future action
- The survey was conducted by way of questionnaires during December 2002 to March 2003. About 2500 filled in questionnaires were received from cities all over the country: New Delhi, Jaipur, Kolkata, Mumbai, Bangalore, Chennai. The responses provided a fairly good idea about common problems being faced by cable TV subscribers in the country.
Following is an analysis of these questionnaires:
No. of channels provided by Cable Operators:
- 43% receive 20-25 channels;
- 29% receive 40-50 channels; and
- 28% receive above 60 channels.
No. of channels viewed:
- 37% respondents watch less than 5 channels;
- 53% watch between 5 to 15 channels; and
- 10% watch more than 15 channels.
Thus, only a handful of channels are viewed by most of the consumers as against the total number of channels broadcasted. Favourite channels differ region-wise but are mostly same in a particular region and amount to merely 2-3 channels per family on an average.
Services provided by Cable Operators:
- 19% respondents were of the view that services provided were of poor quality;
- 58% said that they were fair; and
- 23% said they were good.
Monthly subscription charges:
- About 14% pay less than Rs.150;
- 67% pay between Rs.150-200;
- 10% pay between Rs.200-250;
- 6% pay between Rs.250-300; and
- 3% pay more than Rs.300 as service charges.
Basis of payment:
- 92% pay on monthly basis; while
- 7% pay on quarterly basis.
- Most consumers pay less than Rs.300 as subscription charges
- Also consumers pay as low as Rs.200 quarterly. But most of these consumers are in small areas and have black and white television sets
- In most cases, payment is made on monthly basis
Increase in service charges:
- Around 64% respondents confirmed that there has been an increase in service charges in the last one year;
- 48% said that the charges increased by less than Rs.50;
- 14% said that the increase was between Rs.50-75;
- 9% said it was between Rs.75-100; and
- 5% confirmed that it was above Rs.100.
- 49% of the respondents attributed this increase to the increase in number of channels.
Money receipts:
- 45% confirmed that they were given receipts for payment of subscription charges; while
- 54% were not given any such receipt.
Time taken to rectify complaints:
- 34% said their cable operator rectified complaints within a day;
- 35% said complaints were rectified in two days;
- 22% said in seven days; and
- 8% said it took their cable operators more than 7 days to resolve their complaints.
Complaint docket no. given: Complaint docket number is not given most of the time. In fact, most consumers themselves don’t ask for it.
- Out of the 18% who demand a complaint docket number, an impressive 54% receive the same
- However, overall only 13% of total consumers get a complaint number by the operator.
Cable boys having identity cards/uniforms:
- 74% respondents said that cable boys in their areas do not have any identity cards; while
- 12% confirmed that cable boys in their locality had identity cards.
- 94% said that the boys employed by their Cable Operators did not have any uniform.
- 57% mentioned that they mostly recognized cable boys by their faces while 2% relied on collection cards.
Awareness about Set-top Boxes: An amazing figure of 70% were unaware of the concept of set-top boxes, while 27% were aware.
Option to change the cable operator: 70% did not have an option to change their cable operator while 28% did.
General Comments
- People are not happy with the rentals they pay considering the quality of services they are provided.
Nearly 70% respondents did not have the option to change their Cable Operators due to domain cartels formed by them. - A handful of consumers feel the need of set-top box as customer can then make a choice of the channels s/he wants to watch.
- Consumers reported that the behaviour of operators is generally not very good, primarily because there is no choice.
- Some consumers expressed the need of a regulator for the cable TV industry.
Cable TV: Results of Phase II Survey (2004)
The survey was conducted in four metropolitan cities of India: Delhi, Kolkata, Mumbai and Chennai during March-May, 2004. The survey was conducted by sending questionnaire to randomly selected households. This was complemented by personally interviewing some of the respondents. A total of 1506 persons were surveyed, of which: 282 were from Delhi, 392 from Kolkata, 434 from Mumbai, and 398 from Chennai.
Demographics
Respondents by Occupation (Table 1)
- Majority of respondents (51%) belong to service class
- 16% respondents are students and 13% businessmen
- Housewives constitute 7% of those surveyed
- Self-employed and retired persons constitute 6% each
In terms of the four metros:
- Delhi: maximum number of respondents are students, closely followed by service class.
- Kolkata: maximum number of respondents belong to service class, followed by businessmen.
- Mumbai: maximum number of respondents are those whose occupation is service, followed by students.
- Chennai: while maximum number of respondents belong to service class, a significant number are self-employed, businessmen and housewives
Table 1. Respondents by Occupation
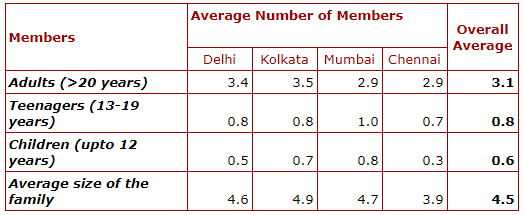
Size of the Family (Table 2)
- On an average, size of the family ranges from 3.9 members in Chennai to 4.9 members in Kolkata. In Delhi and Mumbai average family size is 4.6 and 4.7 respectively
- In all four metros, majority of members in a family are adults (age > 20 years)
Table 2. Size of the Family
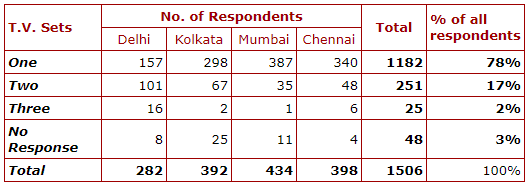
Number of T.V. sets in the house (Table 3)
- Majority of respondents own one TV set (78%). This is also true for all the four metros individually.
- For all four metros combined, 17% own two TV sets, however, in Delhi, significant number of households (about 36%) own two TV sets.
Cable T.V. Scenario in the Four Metros
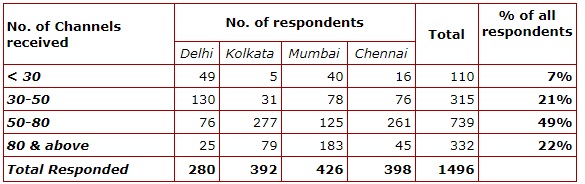
No. of channels received (Table 4)
- Majority of respondents (about 72%) receive 50 or more channels
- However, there is some variation across metros. Except Delhi, most subscribers in the other three metros receive 50 or more channels.
- Delhi: 36% subscribers receive 50 or more channels.
- Kolkata: most of the respondents (91%) receive 50 or more channels
- Mumbai: majority of respondents (72%) receive more than 50 channels
- Chennai: 77% respondents receive 50 or more channels
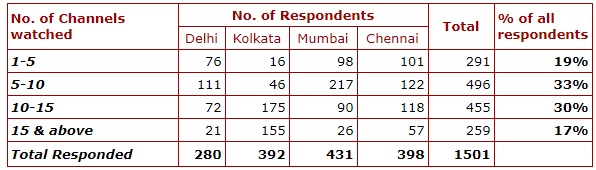
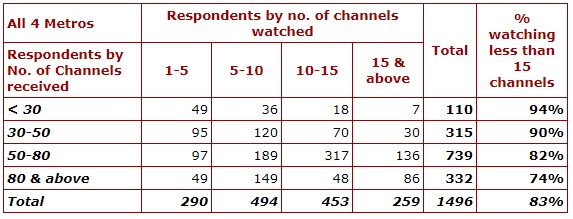
No. of channels watched (Table 5)
- Most subscribers (83%) watch less than 15 channels. In case of the four metros:
- Delhi: most subscribers (93%) watch less than 15 channels
- Mumbai: 94% households watch less than 15 channels
- Chennai: 86% respondents watch less than 15 channels
- Kolkata: In comparison, 60% watch less than 15 channels
Channels watched vis-à-vis channels received (Table 6)
- It was earlier observed that majority of consumers receive more than 50 channels, however, most of these subscribers (79%) usually watch less than 15 channels.
- Thus, consumers usually pay for more than 35 channels, which they do not watch. This is a clear example of restrictive trade practice followed in the cable TV industry.
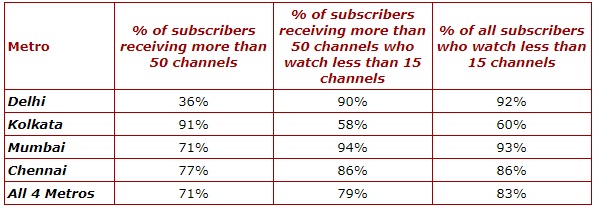
A similar trend is observed across all metros (Table 7)
- In case of both Mumbai and Chennai, majority of subscribers receive more than 50 channels and most of them usually watch less than 15 channels.
- In contrast in Kolkata, though 9 out of 10 subscribers receive more than 50 channels, however, a little over half (58%) of these subscribers, usually watch less than 15 channels.
- The case of Delhi is little different as majority of subscribers receive less than 50 channels. It is observed that most subscribers (92%) usually watch less 15 channels.
- In case of each of the four metros, majority of subscribers watch less than 15 channels
Awareness about disputes (Table 8)
- 74% respondents are not aware of disputes between cable operators.
- Interestingly, maximum awareness about disputes between cable operators is in Kolkata with 37% of those surveyed responding in the affirmative.
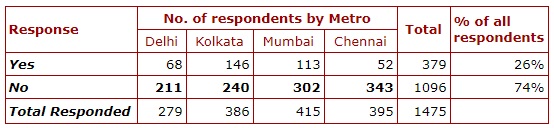
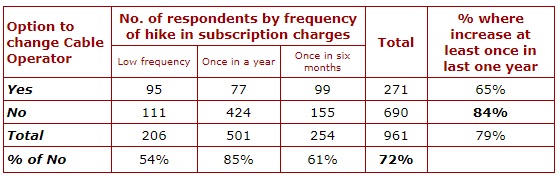
Option to change cable operators (Table 9)
Majority of subscribers (seven out of ten who responded) do not have an option to change their cable operator.
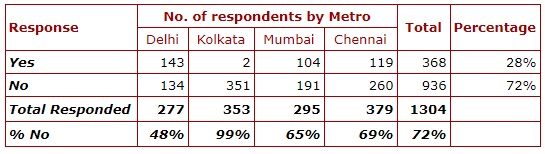
There is some variation across metros with respect to choice available with consumers in terms of changing their cable operator:
- Delhi: Half the respondents in Delhi have an option to change their cable operator.
- Kolkata: In contrast, almost all households in Kolkata (about 99%) do not have the option to change their cable operators.
- 65% consumers in Mumbai and 69% consumers in Chennai do not have the ability to change their cable operators.
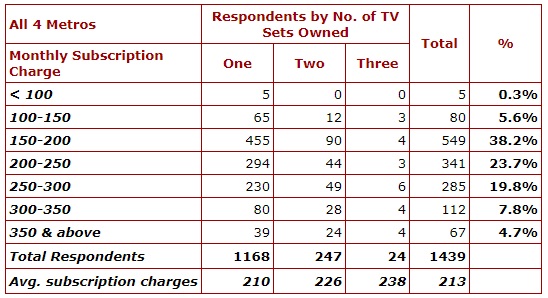
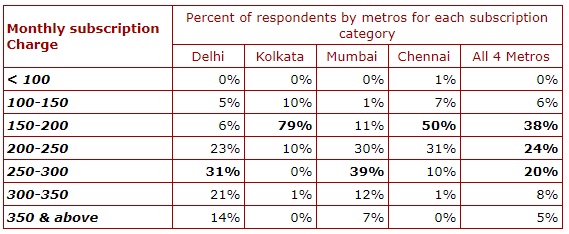
- Majority of consumers (82%) pay between Rs.150-300.
- Interestingly, this is true for consumers owning either one- or two-TV sets as 84% of consumers owning one-TV set and 81% of consumers owning two-TV sets pay between Rs.150-300 per month as subscription charges.
- In fact, the average price paid by consumers owning one-TV set is Rs.210, which is a little less than the average price of Rs.226 paid by consumers owning two-TV sets.
- There is not much difference in the monthly subscription charges paid by households in lieu of the number of TV sets owned by them.
- The average monthly subscription charge for all metros is Rs.213
- There is not much difference in the monthly subscription charges paid by consumers owning either one- or two-TV sets in each of the four metros.
- Majority of respondents in Chennai (91%) and Kolkata (89%) pay between Rs.150-300 as monthly subscription charges. In Mumbai, about 80% respondents pay in this range, whereas in Delhi only about 60% respondents pay between Rs.150-300. In fact, in case of Delhi, about 35% respondents pay more than Rs.300 per month as subscription charges.
- Average monthly subscription charges in Delhi (Rs.253) and Mumbai (Rs.247) are higher than that in Kolkata (Rs.175) and Chennai (Rs.187). Kolkata is the least expensive metro in terms of cable subscription charges, while Delhi is the most expensive.
- In case of Delhi, it was earlier observed that significant number of households (36%) own two-TV sets. However, this does not explain the higher monthly subscription charges paid by subscribers in Delhi, as there is not much difference between the subscription charges paid by consumers owning one- or two-TV sets.
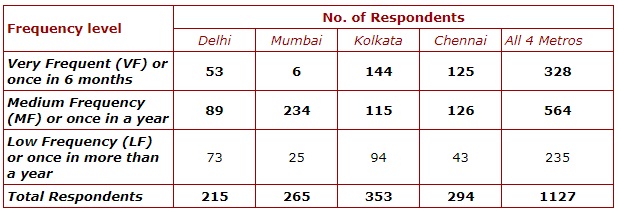
- Almost 8 out of 10 respondents faced an increase in cable TV rates at least once in the last one-year. In fact, 3 out of 10 found their monthly subscription charges increased very frequently.
- In case of Kolkata, most of the respondents (90%), faced a hike in subscription charges at least once in the last one-year. In contrast, a relatively lower proportion of subscribers (66%) in Delhi faced a hike in the last one-year.
- Subscribers in metros with relatively lower subscription charges (i.e. Kolkata and Chennai) faced a more frequent increase in subscription charges than their counterparts in relatively expensive metros (i.e. Mumbai and Delhi).
- While, 72% of households do not have the ability to change their cable operator, 84% of these faced a hike in subscription charges in the last one-year. In other words, most subscribers who do not have the option to change their cable operator faced a hike in subscription charges at least once in the last one-year.
- As observed earlier Kolkata and Delhi are at extremes in terms of ability of subscribers to change cable operators: whereas, almost all subscribers in Kolkata do not have the option to change their cable operator, half the subscribers in Delhi have the option. The affect of this market structure on subscribers in the two metros is apparent from the frequency of hike in subscription charges faced by them. As observed above (Table 13), whereas 9 out of 10 subscribers in Kolkata faced an increase in subscription charges at least once in the last one-year, the comparative figure for Delhi is lower at 66%.
- Among the key improvements that consumers would like are:
- Better picture and audio quality
- Change in order of channels to be stopped
- Prompt attention to complaints including redressal of billing problems
- Lower subscription charges
- Fear of increase in monthly rentals
- High cost of set-top box
- Unnecessary complications and Technical problems
- Will reduce monthly rent
- Will improve picture quality
- Will improve sound quality
- relation between monthly subscription currently paid by households and their response of not favouring CAS; and
- extent to which households’ perception of monthly rent post-CAS is a reason for their not favouring CAS
- Majority of households in each monthly subscription category do not favour CAS (Table 17)
- Further, majority of households give post-CAS expected rise in monthly subscription as chief reason for not accepting CAS (Table 18)
- However, in Mumbai, majority of respondents in monthly subscription category of Rs.200 and above, favour CAS (Table 17)
- Most respondents from Mumbai, expect that CAS would reduce the monthly rentals (Table 18)
- This shows there is variation among respondents in their perception of post-CAS monthly cable subscription charges. While majority of respondents in Mumbai expect post-CAS monthly subscription to fall, respondents in other three metros expect monthly subscription to rise.
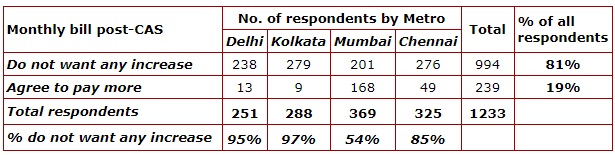
- Post-CAS monthly rental is thus a chief reason for accepting/rejecting CAS. Keeping aside the variation in their perceptions, what emerges is that most respondents do not want an increase in their monthly cable bills, if CAS is implemented (Table 19)
- Moreover, variation in perception of respondents across metros regarding post-CAS monthly subscription charges highlights the poor awareness with respect to CAS. In fact, lack of information about different aspects of transition to the CAS regime has been one of the main reasons for failure of CAS in its first attempt
- 8 out 10 respondents do not want any increase in their monthly bill, if CAS is implemented
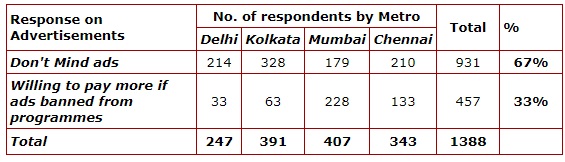
- Majority of consumers (67%) do not mind advertisements on TV
- In contrast, only 3 out of 10 respondents are willing to pay more if advertisements were removed from TV programmes
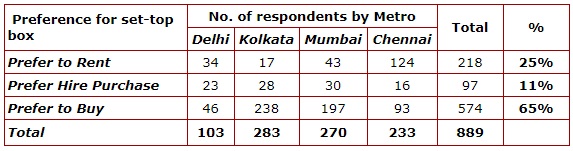
- Majority of respondents in all metros (65%) expressed their preference to buy the set-top box, while one-fourth prefer to rent it. Only one out of ten prefer to hire purchase.
- However, in Chennai, half the respondents prefer to rent a set-top box, while 4 out of 10 prefer to buy.
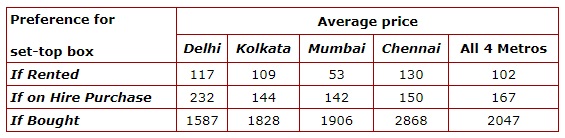
- On average, consumers across the four metros are willing to pay
- Rs.1600 – Rs.2900 for buying a set-top box
- Rs.50 – Rs.130 to rent a set-top box
- Rs.140 – Rs.230 in case of hire-purchase
- The survey has highlighted existence of cable operator’s monopoly at consumers’ end as a result of which consumers’ face frequent hike in subscription charges. In an industry where there is a virtual monopoly at consumers’ end, the survey identifies a crying need to regulate prices and ensure proper service standards at local level. However, the solution does not solely lie in regulating prices charged by cable operators and leaving out broadcasters and multi-system operators, who are very much a part in determining the prices paid by consumers. In fact, in most cases, monopoly of cable operator at consumers’ end is the result of monopoly of the multi-system operator (MSO). Hence, concrete policies are required to check the behaviour of broadcasters, MSOs and cable operators.
- The survey highlights that there is variation across cities in terms of the cable TV system, which is also confirmed by survey results brought out by TRAI. In fact, in most cases problems in the cable TV industry are of local nature. Given this variation and nature of problem, local-level solutions are required to make it a consumer friendly cable TV system. There is an urgent need to decentralize the regulatory enforcement system for regulating the cable TV industry and checking local-level problems.
- The Telecom Regulatory Authority of India (TRAI) in its recent recommendations on cable TV system has identified the need for state governments and local stakeholders to evolve a cable TV system that best suits the state. Local stakeholders such as consumer organisations need to advocate with their respective state governments to take it forward.
- The experience of Chennai suggests that Conditional Access System in its present form has not proved successful. A major reason for this is that even with set-top box channels come in bundled form i.e. there are 5-6 different bouquets available, giving no choice to consumers. For example, ESPN-Star Sports is available as a package at Rs.32 per month provided package is purchase for 12 months. In case of individual subscription, these channels are available at Rs.29 per month subject to annual subscription. Hence, with set-top box even now bundling and tied selling continues. Another important reason for low penetration of CAS in Chennai is that set-top boxes are available only for purchase at a price of Rs.5000, which is quite prohibitive.
- Given this, for CAS to be successful, bundling of channels need to be scrapped. Further, set-top boxes must be made available on rental basis and provided in a manner similar to the way LPG cylinders are available. That is, consumer pays a deposit amount for getting the set-top box and in case of transfer can return the set-top box to MSO/LCO, get the deposit back and take another set-top box in the area of transfer. Hence, the meeting realized that CAS is a good system and would be successful if introduced with certain safeguards for consumers.
- Given the emergence of alternate delivery platforms, TRAI has to ensure that the “must-provide clause” for all TV channels is adhered to in a non-discriminatory manner. This would ensure competition at local level and choice to consumers. TRAI is soon going to come out interconnect draft in the next few days.
-
Thus, Delhi and Kolkata are at the two extremes in terms of consumers’ ability to change cable operators.
Monthly Cable TV Subscription Charges (Table 10)
In case of the four metros (Table 11)
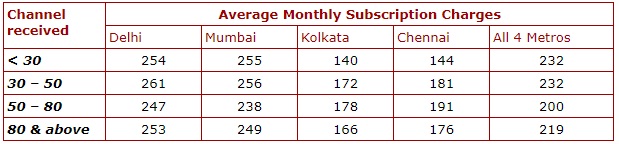
Monthly subscription charges vis-à-vis channels received (Table 12)
There is no evidence of an increase in average monthly subscription charges with the provision of more channels i.e. a consumer who receives more channels, on an average, does not pay a higher subscription charge. This is also true for each metro.
Frequency of increase in Cable TV subscription charges (Table 13)
Is inability to change cable operator accompanied by a frequent hike in cable subscription rates (Table 14)?
This clearly indicates the need for regulating prices, especially when there is a monopoly of cable operator at the local level.
Improvements in the present cable TV system
Conditional Access System (CAS)
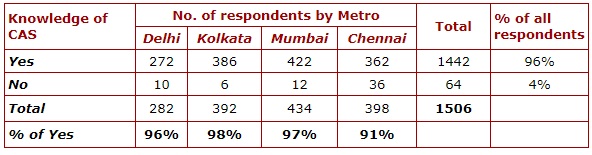
Most respondents (96%) had heard of CAS, which is evident across all metros(Table 15)
However, majority of respondents in all four metros (63%) are not in favour of accepting CAS (Table 16). Key reasons cited for not accepting CAS are
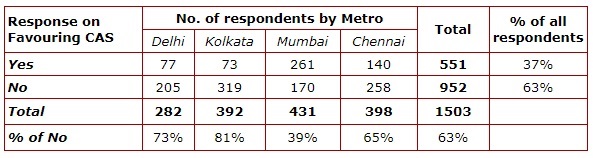
However, in Mumbai, majority of consumers (61%) are in favour of accepting CAS and the main reasons advanced are:
Correlation between monthly subscription charges and acceptance of CAS (Tables 17 & 18)
Given that most respondents have knowledge of CAS and majority of them are not in favour of accepting CAS, we attempt to find out:
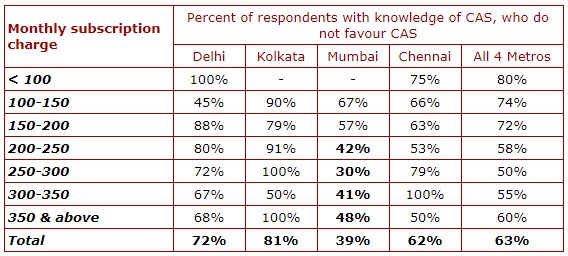
Table 18. Percentage of Respondents who give Post-CAS Monthly Rent as Reason for not accepting CAS
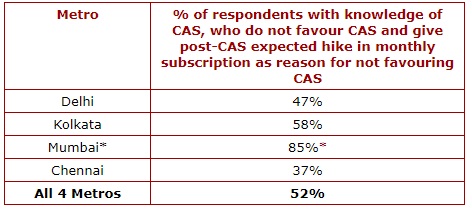
Since majority of respondents in Mumbai are willing to accept CAS, the figure represents % of respondents with knowledge of CAS, who favour CAS and give post-CAS expected fall in monthly subscription as reason for accepting CAS
What monthly bill would you prefer, if CAS is implemented (Table 19)
If advertisements were banned, how much more would you pay (Table 20)
Mode of procuring set-top box (Table 21)
Cost Range for set-top box (Table 22)
Conclusions
D-217 Bhaskar Marg, Bani Park,
Jaipur 302016
Phone: +91.141.228 2821
Fax: +91.141.228 2485
Email: cuts@cuts.org
Website: http://www.cuts-international.org/